What is the Principal Financial Well-Being IndexSM (WBI)?
A deep dive into the financial well-being of U.S. employers and employees. The research provides helpful insight into key workplace and employment trends in the small to midsize business marketplace through a steady cadence of surveys with new and recurring themes. WBI also compares employer sentiment with that of employees, offering a holistic perspective.
These insights help employers identify and implement solutions that position their business, their employees, and themselves to achieve greater financial security.

Latest findings
Expectations around how and when to retire by generation vary greatly – placing increased focus on employee engagement and personalized investment strategies to help improve financial security and retirement readiness.
Download full report (PDF)Business financial health
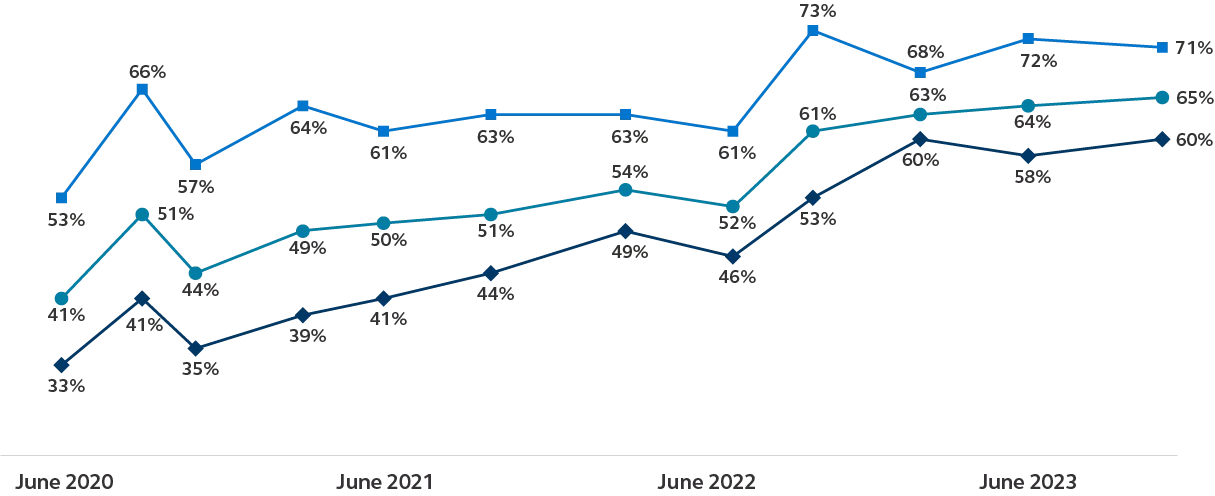
Businesses continue to navigate tough economic conditions and have demonstrated steady growth through recent events.
Businesses who describe themselves as growing (%)
- All
- Small businesses
- Large businesses

Employee benefits
Employers recognize the need to support their employees through workplace benefits. Top benefits employers plan to increase include training and education, mental health programs, and flexible schedules.
Employee benefit to change in next 12 months
- Increase
- Decrease
- No change
What’s next?
Ensure your business can grow in the long term by offering benefits that matter. Principal can help design a benefits package that's just right for employers and their employees.
Key takeaways

74% of Gen Z employees say it’s important for them to work at a company whose policies and practices align with their personal beliefs.

69% of businesses say it’s their responsibility to help employees save for retirement.

46% of businesses using small retail banks are concerned about the safety of their bank deposits.

36% of businesses are planning to increase mental health and well-being programs.
Methodology
The WBI is recurring research used to track sentiment around repeated financial health measures and timely issues relevant to small and midsize businesses and their employees. Business owners, decision makers, and business leader participants who represent companies with between 2 to 10,000 employees and offer health insurance and/or retirement benefits (n=500) provide information by completing a 15 minute online survey. Research is also conducted with an employee audience of those 18 and older who are employed full time and have an employer who offers health insurance and/or retirement as a sponsored benefit (n=200). Access to sample is provided by Dynata, a third-party research panel provider.
The WBI was transformed in 2020 from an annual survey to a regular pulse survey offering three waves yearly. In March 2022, the employee audience was added to the survey to compare and contrast key sentiment from employers.
Want to stay up to date on our insights?
Have a question for our media team?
