Capital Appreciation Inst Fund (PWCIX) |
 |
Portfolio Composition
as of 02/29/2024 What's this?
|
Top 10 Holdingsas of 02/29/2024
What's this?
View Full Portfolio Holdings |
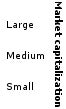
Morningstar Style Box™as of 02/29/2024
What's this?
|
|||||||||||||||||||||||||||||||||||||||||||||||||||
Stock Sector Breakdownas of 02/29/2024
What's this?
|
Analysisas of 02/29/2024
|


© 2024 Morningstar, Inc. All Rights Reserved. Part of the mutual fund data contained herein: (1) is proprietary to Morningstar and/or its content providers; (2) may not be copied or distributed; and (3) is not warranted to be accurate, complete, or timely. Neither Morningstar nor its content providers are responsible for any damages or losses arising from any use of this information. Past performance is no guarantee of future results. Investment options are subject to investment risk. Shares or unit values will fluctuate and investments, when redeemed, may be worth more or less than their original cost. Portfolio holdings are subject to change and companies referenced in this report may not currently be held. Information is current as of the creation of this piece. Keep in mind that portfolio holdings are subject to risk. Click here for a complete list of the most recent publicly available holdings. Insurance products and plan administrative services, if applicable, are provided by Principal Life Insurance Company. Principal Funds, Inc. is distributed by Principal Funds Distributor, Inc. Securities are offered through Principal Securities, Inc., 800-547-7754, member SIPC and/or independent broker/dealers. Securities sold by a Principal Securities Registered Representative are offered through Principal Securities. Principal Funds Distributor, Principal Securities and Principal Life are members of the Principal Financial Group®, Des Moines, IA 50392. Certain investment options may not be available in all states or U.S. commonwealths. The full name of this investment option is Principal Funds, Inc. - Principal Capital Appreciation Inst Fund. Investors should carefully consider a mutual fund's investment objectives, risks, charges, and expenses prior to investing. A prospectus, or summary prospectus if available, containing this and other information can be obtained by contacting a financial professional, visiting principal.com, or calling 1-800-547-7754. Read the prospectus carefully before investing. Not FDIC Insured May Lose Value - Not a Deposit - No Bank Guarantee Not Insured by any Federal Government Agency |
|||
| Fees and expenses are only one of several factors that participants and beneficiaries should consider when making investment decisions. The cumulative effect of fees and expenses can substantially reduce the growth of a participant's or beneficiary's retirement account. Participants and beneficiaries can visit the Employee Benefit Security Administration's website for an example demonstrating the long-term effect of fees and expenses. |
|||
|