DWS Small Mid Cap Value VIP Division |
 |
Portfolio Composition
as of 03/31/2025 What's this?
|
Top 10 Holdingsas of 03/31/2025
What's this?
|
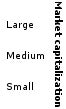
Morningstar Style Box™as of 03/31/2025
What's this?
|
|||||||||||||||||||||||||||||||||||||||||||||||||||
Stock Sector Breakdownas of 03/31/2025
What's this?
|
Analysisas of 03/31/2025
|


© 2025 Morningstar, Inc. All Rights Reserved. Part of the mutual fund data contained herein: (1) is proprietary to Morningstar and/or its content providers; (2) may not be copied or distributed; and (3) is not warranted to be accurate, complete, or timely. Neither Morningstar nor its content providers are responsible for any damages or losses arising from any use of this information.
|