Retirement plans Get the most out of your employer-sponsored retirement plans, including a 401(k).
Annuities Use a guaranteed income stream to help diversify your retirement options.
Individual retirement accounts (IRAs) Set up (and save in) a tax-advantaged account that’s just right for you.
Enroll today, save for tomorrow.
Sign up for your workplace retirement plan.

Enroll now

Looking for a dentist in your network?
Search our directory or browse a list of providers in your area.

Find a dentist

Create an account
Set up your online access and update your information.

Get started

Benefits and insurance Find out how to protect what matters most and support your well-being.
Estate planning Learn how to build a foundation to help your loved ones and leave a legacy.
Financial planning Discover tools, tips, and insights to help reach your short- and long-term goals.
Investing Create a plan and boost your knowledge so you know how to make financial progress.
Retirement Strategies to save for (and enjoy) your retirement.
View all articles
Featured Article

How to create your own lifelong financial plan, step by step

Create a just-for-you path to balance your short- and long-term goals.

How can we help you? Close
Visit the search page to explore all content and features.
Log in

For individuals

About Us Global insights Principal Financial Well-Being Index
Principal Financial Well-Being IndexSM

2026 Wave 3

The Principal Financial Well-Being Index is our comprehensive quarterly study of the financial health of U.S. employers. The index score factors in business health, growth, and optimism based on economic outlook. Our research draws insights from business owners, key decision makers, and executive leaders across organizations ranging from small businesses to large enterprises (2–10,000 employees) that offer employee benefits and retirement plans.

All businesses Small businesses Large businesses
Graphic showing a 6.55 out of 10 index score for all businesses
Chart showing how the July 2026 index score of 6.55 compares to scores from the last four years, starting with 6.84 in July 2022
Graphic showing a 6.11 out of 10 index score for small businesses.
Chart showing how the July 2026 index score of 6.11 for small businesses compares to scores from the last four years, starting with 6.35 in July 2022.
Graphic showing a 7.18 out of 10 index score for large businesses
Chart showing how the July 2026 index score of 7.18 for large businesses compares to scores from the last four years, starting with 7.68 in July 2022.
Business financial health

Businesses are increasingly optimistic about the economy, with confidence in both U.S. and local economic growth returning to pre-tariff-announcement levels (November 2024). Confidence in their own financial growth is stabilizing, but has not yet fully recovered to levels seen in 2023 and 2024.

Business actions and reactions
Staffing and wages hold steady despite anticipated AI disruption

Businesses continue to grow their workforce at a steady pace, in line with broader labor market trends. That confidence extends to their outlook on AI: Most expect adoption to support stable or growing staffing levels and wages, with sentiment even stronger than it was when asked in October 2025.
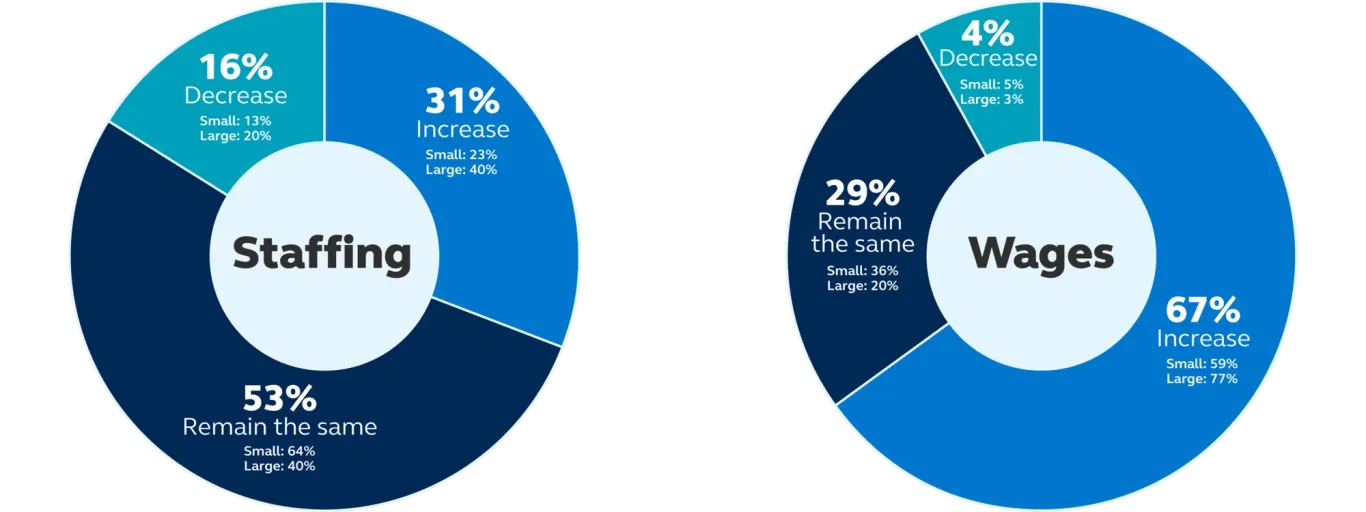

How businesses expect AI to impact staffing and wages
Chart showing that 31% of businesses expect to increase staffing because of AI, 53% expect no change, and 16% expect to decrease

Limited negative AI impacts to employment and wage growth are further supported by Principal customer data. Overall employment growth within our employer customer base remains stable and in line with the prior three months, and customers continue to report increasing wages. Knowledge industries continue to grow faster than non-knowledge industries, and small and midsized employers are outpacing large employers in employment growth.

 Amy Friedrich, president of Benefits and Protection at Principal

“Much of the public conversation around AI has focused on potential job losses, but employers are telling a more nuanced story. We're seeing broadening AI adoption alongside relatively stable staffing levels and continued investment in talent. That aligns with what we're hearing from employers across our client base, where the focus is less on workforce reduction and more on using AI to increase productivity, support employees, and help drive business growth.”

Amy Friedrich

President, Benefits and Protection, Principal®


“We do not expect AI to decrease or increase our workforce numbers. But we already expect higher and more sophisticated output from current staff.”

Administrative services business with 200–499 employees in California


More employees delaying retirement due to current economic conditions

Sixty-nine percent of businesses agree they're seeing an increase in employees delaying retirement because of financial security concerns, with cost of living, savings, and healthcare topping the list.
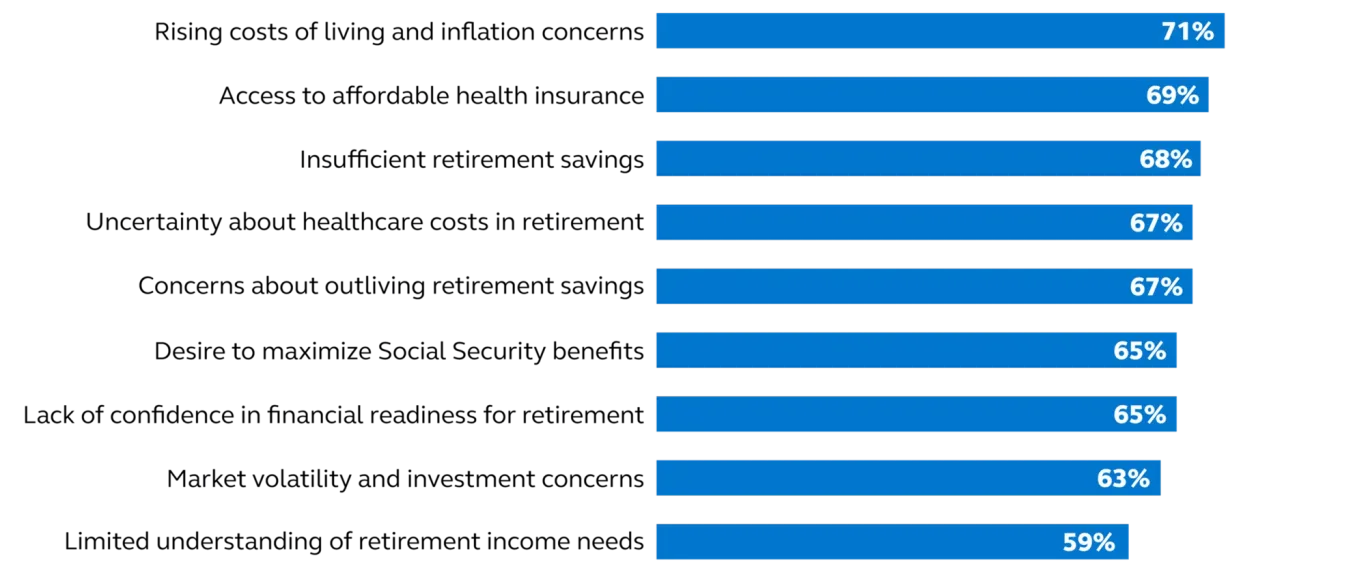
Benefit-related reasons employees delay retirement
 Chart showing the top benefit-related reasons employees delay retirement, including rising costs of living and inflation concer
Employers slow the pace of phased retirement adoption as labor market conditions fluctuate

Changing workforce needs and labor market conditions are prompting employers to take a more targeted approach to retaining experienced workers, rather than relying on formal phased retirement programs.
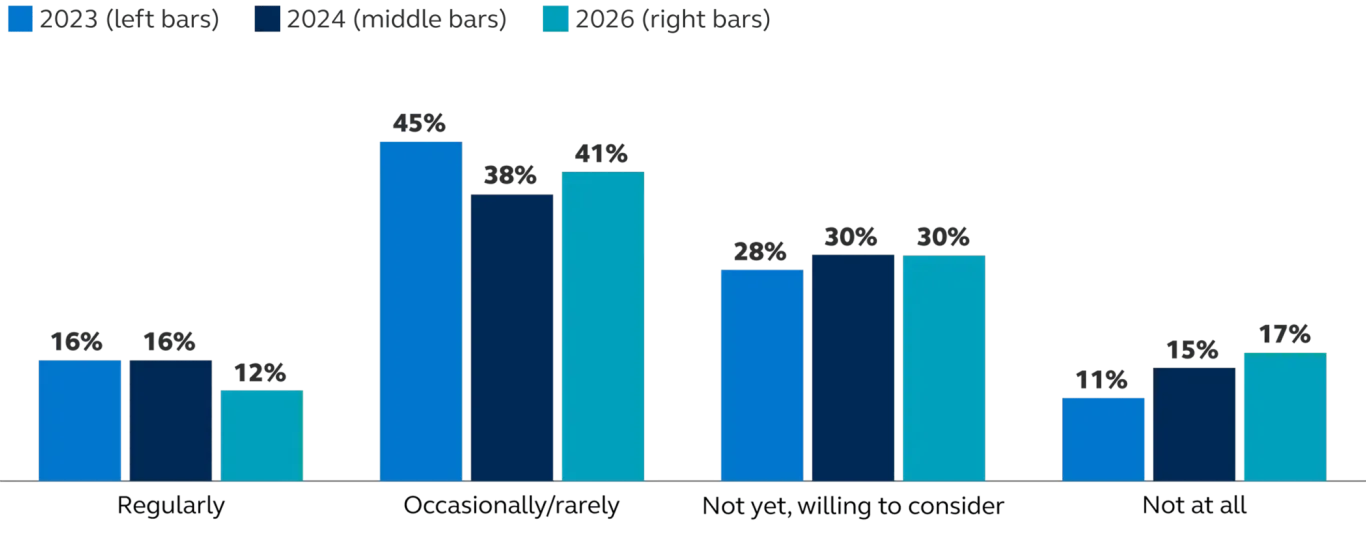

Frequency of businesses offering phased retirement plans
Bar chart showing how often businesses offer phased retirement plans in 2023, 2024, and 2026. Regular offerings became less comm
Teresa Hassara, senior vice president of Workplace Savings and Retirement Solutions at Principal

“Retirement looks different for every person, but the need for confidence is consistent. At a time when economic uncertainty is weighing on many households, people want to know whether they’re on track and what steps they can take next. A strong retirement plan can help by pairing savings with guidance and income strategies that support employees across income levels and help them move toward retirement with greater confidence.”

Teresa Hassara

SVP, Workplace Savings and Retirement Solutions, Principal®

View past reports
2026 2025 2024 2023 2022 2021

Principal Financial Well-Being Index Wave 2

Principal Financial Well-Being Index Wave 1

Principal Financial Well-Being Index Wave 3

Principal Financial Well-Being Index Wave 2

Principal Financial Well-Being Index Wave 1  |  Download full report (PDF)

Principal Financial Well-Being Index Wave 3 (PDF)

Principal Financial Well-Being Index Wave 2 (PDF)

Principal Financial Well-Being Index Wave 1 (PDF)

Principal Financial Well-Being Index Wave 3 (PDF)

Principal Financial Well-Being Index Wave 2 (PDF)

Principal Financial Well-Being Index Bank Pulse (PDF)

Principal Financial Well-Being Index Wave 1 (PDF)

Principal Financial Well-Being Index Wave 3 (PDF)

Principal Financial Well-Being Index Wave 2 (PDF)

Principal Financial Well-Being Index Wave 1 (PDF)

Principal Financial Well-Being Index Wave 3 (PDF)

Principal Financial Well-Being Index Wave 2 (PDF)

Principal Financial Well-Being Index Wave 1 (PDF)

Methodology

The Principal Financial Well-Being Index℠ (WBI) Wave 3 (June 22–July 13, 2026) is recurring research used to track sentiment around repeated financial health measures and timely issues relevant to businesses.

Business owner, decision maker, and leader participants who represent companies with 2–10,000 employees (n=1,000) provide information by completing a 15-minute online survey. Access to sample is provided by ROI Rocket, a third-party research panel provider.

In 2025, the WBI added a formal index. The index number in the WBI is calculated by taking responses from six perceptual measures evaluating current financial health, financial comparisons year over year, and projections for business and economic outlook. The percentages of respondents who answered positively for each measure are averaged and standardized to a 0–10 scale, with perceptions of business/company, local economic, and U.S. economic growth weighted 60%, 20%, and 20% respectively within their aggregate measure.

Small businesses = 2–499 employees, Large businesses = 500–10,000 employees

Want to stay up to date on our insights?
Have a question for our media team?